Enter, exit, dwell
Evaluate moving entities against areas of interest, require dwell duration, suppress duplicate alerts and retain the triggering observation.
The engine joins live feature streams, event rules, video telemetry, mission workflows and 3D scene services in one data plane instead of isolating them behind separate server products.
Ingest adapters translate heterogeneous sources into common feature and event representations. Consumers can subscribe to current state or updates without understanding every upstream protocol.
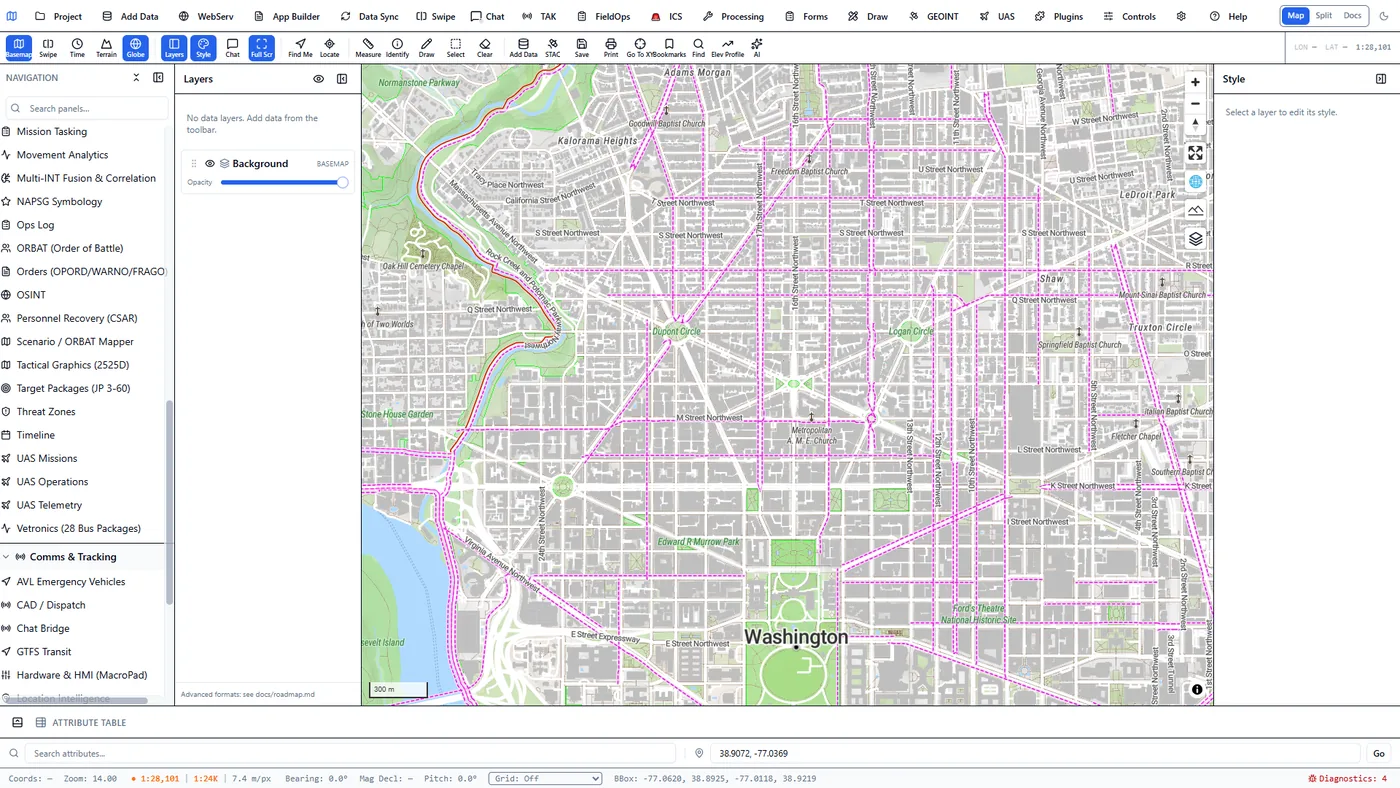
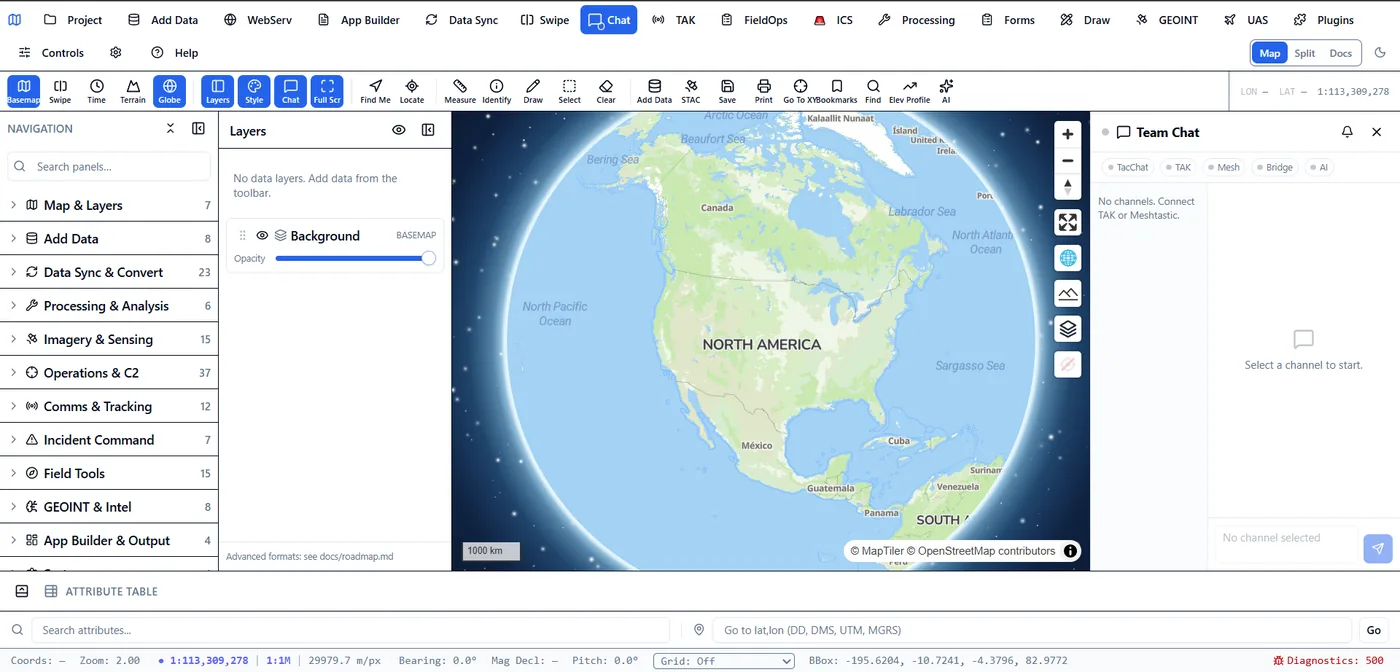
Event handling spans simple thresholds and operational patterns, with state retained for alerts, review and after-action analysis.
Evaluate moving entities against areas of interest, require dwell duration, suppress duplicate alerts and retain the triggering observation.
Detect sensor values crossing configured bounds, apply cooldowns and route notifications through SMS, email, push or HMAC-signed webhooks.
Classify starts, stops, turns, U-turns, acceleration and deceleration; calculate dwell, rendezvous and co-travel patterns.
Aggregate H3 space-time cubes, compare periods, score emerging hotspots and build time-series bins from multi-source observations.
Track subsystem health and escalate through normal, degraded, critical and emergency tiers when dependent services fail.
Match entities by equality, containment, regular expression or geographic proximity with confidence scoring across feeds.
Author SQL predicates against watched DuckDB data files; the events extension re-evaluates rules on each commit and fires alerts through the same notifier—with a poll fallback when the extension is unavailable.
Streams and files are joined to telemetry, map position, events and analytical results rather than living in an isolated player.
RTSP, RTMP, HLS, DASH and file-based video workflows, with HTTP range support for seeking and operational playback.
Extract MISB 0601 KLV telemetry, GoPro GPMF metadata and DJI SRT GPS to position platforms, frames and sensor footprints.
Use camera models and DEMs to project image coordinates onto the ground and persist video digitizing as map features.
YOLO-based object detection, OCSort tracking, zone entry/exit and dwell analysis, plus enhancement and frame extraction.
Synchronize tracks, map events and video observations for after-action review instead of treating each feed as a separate timeline.
3DGeoServEngine handles both Esri I3S/SceneServer and OGC 3D Tiles pipelines, alongside models, point clouds, BIM and emerging volumetric formats.
| Data family | Ingest / processing | Serving / client path | Analytical use |
|---|---|---|---|
| I3S / SLPK | Read scene layers and SLPK packages; expose nodes, geometry, textures and statistics | Esri-compatible SceneServer and ArcGIS SceneLayer; bridge to Cesium-oriented visualization | Feature queries, styling and scene inspection |
| OGC 3D Tiles | Read 3TZ/tilesets; generate optimized 3D Tiles 1.1 and implicit tiling | Cesium-compatible tileset and binary-content endpoints | Tile metadata, style evaluation and feature selection |
| LiDAR / point cloud | LAS, LAZ, E57 and COPC-oriented conversion/streaming paths | Range-addressable point-cloud content and 3D Tiles outputs | Elevation, classification, terrain and surface workflows |
| Gaussian splats | PLY, SPLAT and SPZ ingestion with compression/conversion | 3D Tiles 1.1 or raw range-served splat content | Rapid reality capture and immersive inspection |
| BIM / urban models | IFC2x3/IFC4, CityGML, CityJSON, GLB/glTF and model conversion | Web 3D viewers, scene overlays and tile conversion | Indoor hierarchy, routing, assets and digital twins |
| Terrain / elevation | COG, DTED, SRTM and generated DEM products | ImageServer/LERC elevation, raster DEM terrain and 3D analysis services | Viewshed, slope, skyline, volume and line-of-sight |
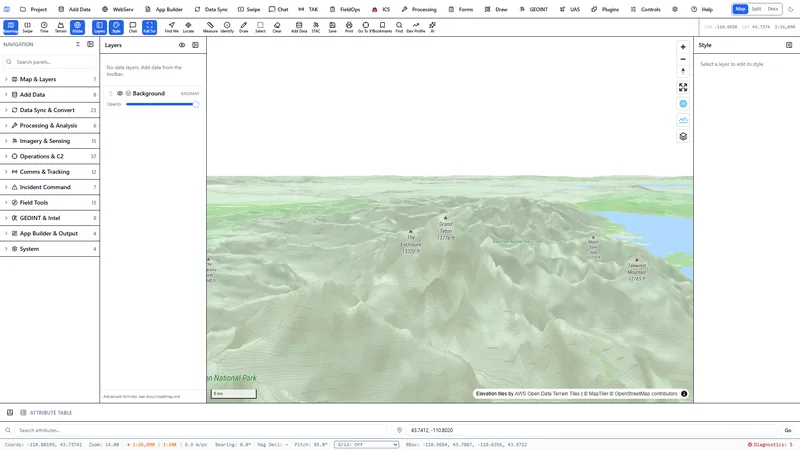
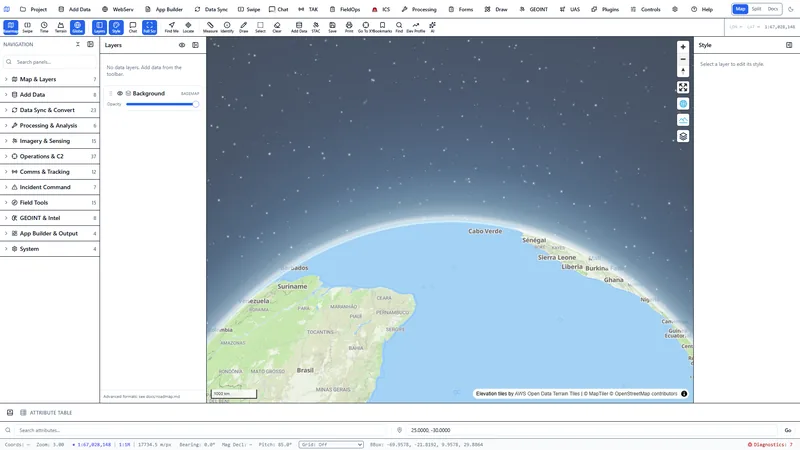
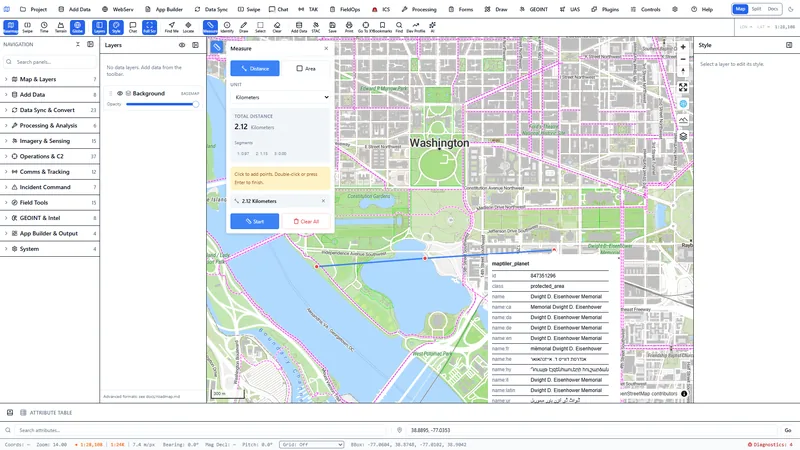
The same 3D terrain and measurement tools shown above, recorded live against the real client rather than staged for a demo.
The shared backend includes mission planning, field data collection, incident command and application-composition capabilities that would normally span multiple server roles.
Role-protected packages, immutable approved baselines, map views, operational overlays, comments, actions, audit trails and DOCX/PDF/mapbook publication.
Incident records, FEMA/NIMS ICS forms, IAPs, resources, tasks, assignments, geofences, documents, dashboards and government-standard CAP/EDXL/NIEM/CoT composition.
XLSForm/Survey123-style forms, Field Maps formInfo, repeat groups, attachments, GlobalIDs, offline dirty tracking, conflict handling and FeatureServer/PostGIS synchronization.
Compose responsive multi-page applications from map, filter, table, chart, indicator and navigation widgets, wire interactions and export a standalone HTML application.
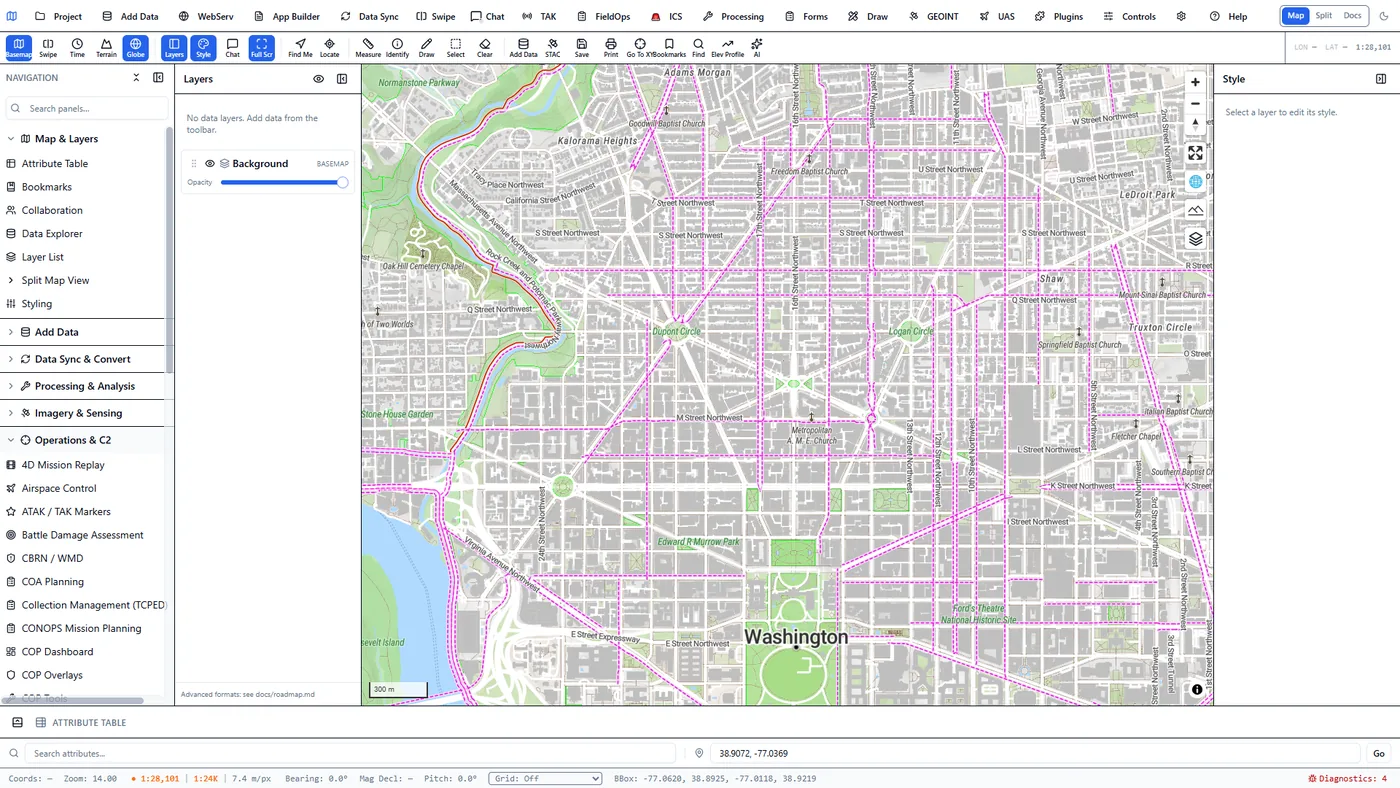
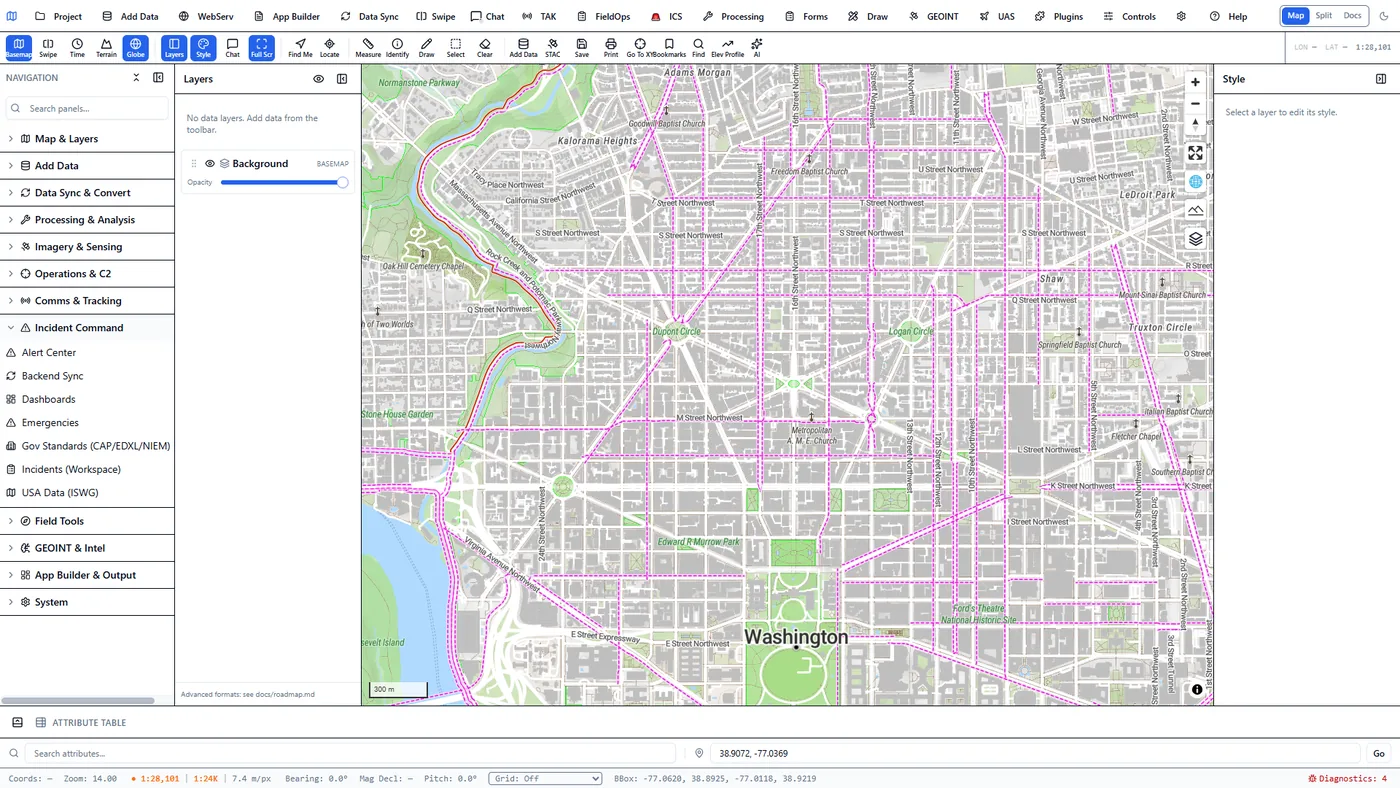
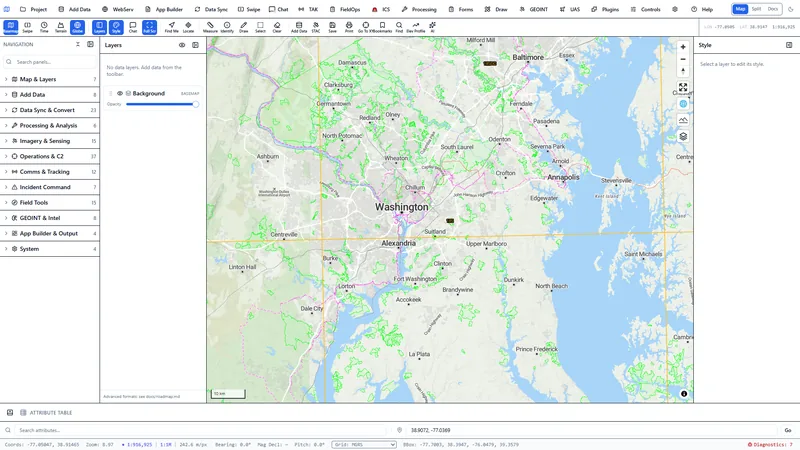
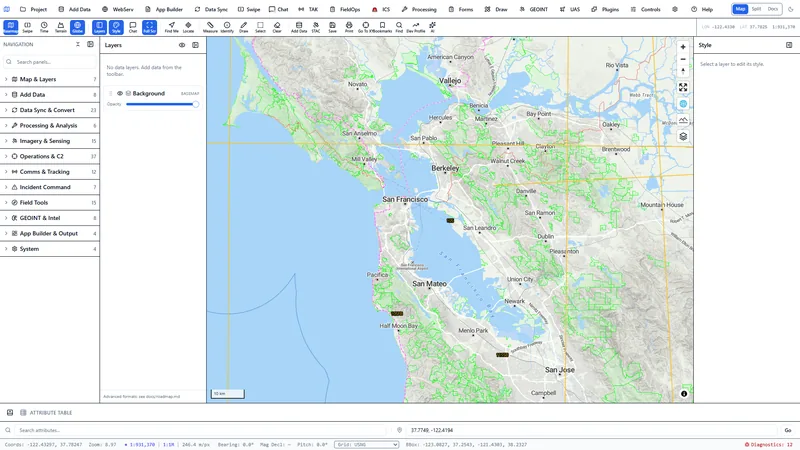
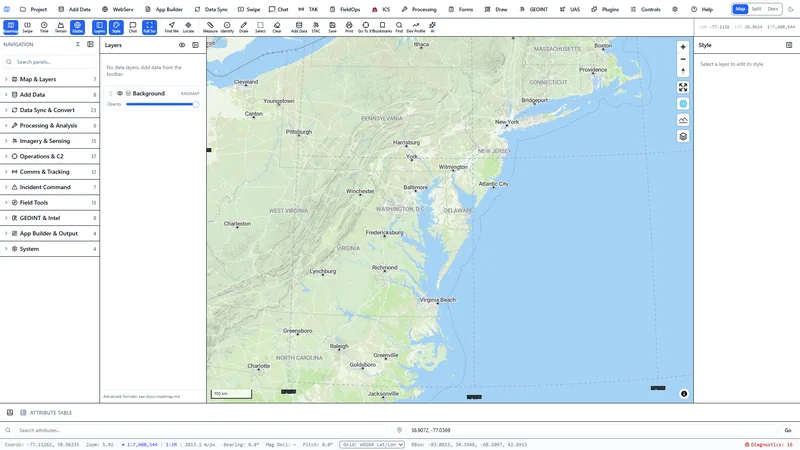
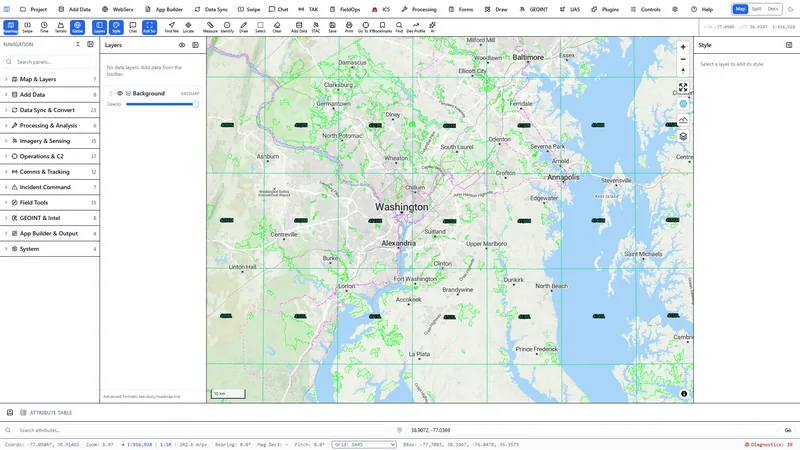
Cross-agency and military operations need a shared grid vocabulary, not just a basemap. The four grid systems below render over the live map alongside the operational layers documented on this page.